
Neurosynth’s Association and Uniformity Tests as Probability Ratios#
Neurosynth [yarkoni2011] maps each term with two tests on the counts of studies activating each voxel:
the uniformity test (formerly “forward inference”): is the proportion of the studies of the term activating the voxel different from its average over the brain?
the association test (formerly “reverse inference”): are the term and the activation of the voxel independent? The map comes with the posterior probability of the term given the activation, for a uniform prior of 0.5.
Both are \(\chi^2\) tests, and both reduce to a ratio of probabilities
which is 1 when there is no effect. With selected_study the uniform
choice over the \(N\) studies of the neurosynth engine, every
probability of a query is a count of studies divided by \(N\), so
these ratios are queries of the engine.
The ratios#
Let \(T\) be the event that the selected study has the term and \(A_v\) that it activates the voxel \(v\).
Association. \(T\) and \(A_v\) are independent if and only if the lift
is 1, and the \(\chi^2\) statistic of the test is \(N\) times the squared distance of the lift to 1:
The relative risk \(RR_v = P(A_v \mid T) / P(A_v \mid \lnot T)\) is also 1 under independence, and Neurosynth’s posterior for a prior of 0.5 is \(RR_v / (1 + RR_v)\).
Uniformity. The average over the \(M\) voxels of the mask of
\(P(A_v \mid T)\) is itself a probability: with selected_voxel a
uniform choice over the voxels and \(V\) the voxel it selects, it is
\(\bar p = P(A_V \mid T)\), the probability that the selected study
activates the selected voxel, given the term. The ratio
is 1 under uniformity, and, with \(N\, P(T)\) the number of studies of the term,
In the REPL#
Neurosynth works on the 2 mm MNI grid, a study activating the voxels
within 6 mm of its peaks, and a term being in the studies with a TF-IDF
above 0.001. Start the REPL of the neurosynth engine on the 2 mm
grid:
python -m neurolang.utils.cli -e neurosynth -d neurolang_data -r 2 -i
and paste this block at the prompt. It computes the lift and the
uniformity ratio of the term pain over the voxels of
cortical_mask, shows the five voxels of the largest uniformity
ratios, and opens both maps in the viewer:
term_of_interest('pain')
term_in_study(s, t) :- term_in_study_tfidf(s, t, w) & (w > 0.001)
activation(i, j, k, s) :- cortical_mask(i, j, k) & peak_reported(i1, j1, k1, s) & (EUCLIDEAN(i, j, k, i1, j1, k1) <= 3)
n_voxels(count(i, j, k)) :- cortical_mask(i, j, k)
selected_voxel(i, j, k) ^ (1 / m) :- cortical_mask(i, j, k) & n_voxels(m)
p_a(i, j, k, PROB) :- activation(i, j, k, s) & selected_study(s)
p_term(t, PROB) :- term_of_interest(t) & term_in_study(s, t) & selected_study(s)
p_a_given_t(t, i, j, k, PROB) :- (activation(i, j, k, s) & selected_study(s)) // (term_of_interest(t) & term_in_study(s, t) & selected_study(s))
p_any_voxel_given_t(t, PROB) :- (activation(i, j, k, s) & selected_voxel(i, j, k) & selected_study(s)) // (term_of_interest(t) & term_in_study(s, t) & selected_study(s))
ratios(t, i, j, k, lift, relative_risk, uniformity) :- p_a_given_t(t, i, j, k, pat) & p_a(i, j, k, pa) & p_term(t, pt) & p_any_voxel_given_t(t, pbar) & (lift == pat / pa) & (relative_risk == pat * (1 - pt) / (pa - pat * pt)) & (uniformity == pat / pbar)
.sort uniformity:desc
.head 5
ans(i, j, k, lift, uniformity) :- ratios(t, i, j, k, lift, relative_risk, uniformity)
.view
The REPL runs the rules as one submission, then each dot-command and the query in turn, and prints the following; on a terminal, it opens the viewer in the browser rather than telling to:
defined term_of_interest/1
defined term_in_study/2
defined activation/4
defined n_voxels/1
defined selected_voxel/3
defined p_a/4
defined p_term/2
defined p_a_given_t/5
defined p_any_voxel_given_t/2
defined ratios/7
Running query...
╭────┬────┬────┬────────────────────┬───────────────────╮
│ i  │ j  │ k  │ lift               │ uniformity        │
├────┼────┼────┼────────────────────┼───────────────────┤
│ 32 │ 76 │ 38 │ 2.226988767904886  │ 8.429294107164303 │
│ 68 │ 77 │ 36 │ 1.8881881487320984 │ 8.124620826182461 │
│ 68 │ 78 │ 35 │ 1.6834056926626453 │ 8.02306306585518  │
│ 68 │ 78 │ 36 │ 1.7016328231323106 │ 8.02306306585518  │
│ 32 │ 78 │ 36 │ 1.5440078879368966 │ 8.02306306585518  │
╰────┴────┴────┴────────────────────┴───────────────────╯
128248 rows · showing 1–5 · .more for next
Query completed in 13.67 s
Saved NIfTI image to: /var/folders/m_/9f8m55cs45g8_36d1wx67_jc0000gr/T/neurolang_view_iqj9l527.nii.gz (128248 voxels of the 99×117×95 template grid, value: the max of 'lift' per voxel)
Saved NIfTI image to: /var/folders/m_/9f8m55cs45g8_36d1wx67_jc0000gr/T/neurolang_view_iiwq4x8r.nii.gz (128248 voxels of the 99×117×95 template grid, value: the max of 'uniformity' per voxel)
Colormap of 'lift': one-sided, the image has no negative values (--symmetric for a symmetric one).
Colormap of 'uniformity': one-sided, the image has no negative values (--symmetric for a symmetric one).
Saved the viewer to: /var/folders/m_/9f8m55cs45g8_36d1wx67_jc0000gr/T/neurolang_view_k39mctvq.html
Open it in a browser to see the image.
The rules, in order:
term_of_interestnames the term. It is joined in the probabilistic rules, so that they are only computed for this term; change it to map another one.activationholds the voxels within 6 mm, 3 voxels of the grid, of a peak of each study, theEUCLIDEANdistance being in voxels.selected_voxelis a uniform choice over the voxels of the mask, each of probability \(1/M\).p_a,p_termandp_a_given_tare \(P(A_v)\), \(P(T)\) and \(P(A_v \mid T)\);p_any_voxel_given_tis \(\bar p = P(A_V \mid T)\), a single probability per term.ratiosdivides them. The relative risk is computed from these probabilities, as \(P(A_v \mid \lnot T) = (P(A_v) - P(A_v \mid T) P(T)) / (1 - P(T))\), rather than with a query conditioned on~term_in_study(s, t), which is slower.
The voxels of the largest uniformity ratios, (32, 76, 38) and
(68, 77, 36) of the grid, are at \((-34, 18, 4)\) and
\((38, 20, 0)\) mm in MNI space, in the left and right anterior
insula: the studies of pain activate them 8 times more often than the
average voxel of the cortex.
.view shows each value column of the result as an overlay, here
lift and uniformity, each from the 95th percentile of its
values, with its colormap and colour bar; the read-out gives both values
at the cursor, here at the left anterior insula:
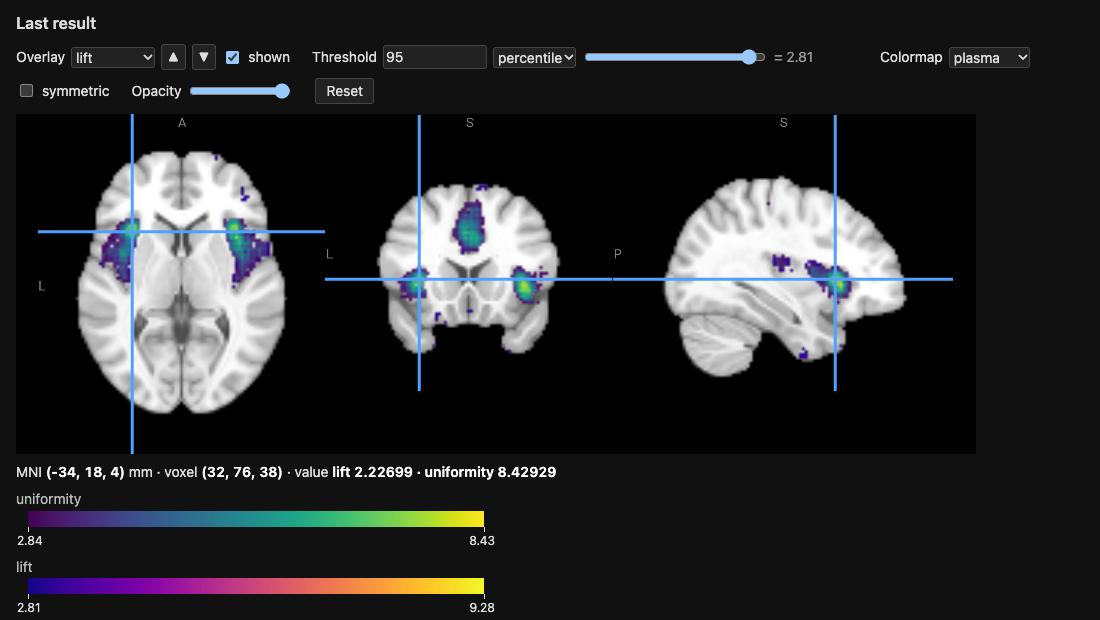
The Overlay list chooses the map the controls apply to, and
shown hides it; uniformity, drawn over lift, covers it where
both pass their threshold, until ▼ draws it under lift. The voxels without a value, those that no
study of the term activates, are 0 and not drawn; .view --fill 1
gives them the ratio of no effect instead. Add relative_risk to the
head of ans for a third overlay, its infinite values being drawn as
its largest finite one.
Notes:
The mask is that of
cortical_mask: the average of the uniformity test is over the cortex, whereas Neurosynth’s is over the whole brain.A voxel which no study of the term activates is not in the result: its ratios are 0. The relative risk is infinite at a voxel which only the studies of the term activate.
The lift and the relative risk are largest at voxels which few studies activate, where they are the least stable: weigh them with \(P(A_v)\), or with the \(\chi^2\) statistic above.
T. Yarkoni, R. A. Poldrack, T. E. Nichols, D. C. Van Essen and T. D. Wager. Large-scale automated synthesis of human functional neuroimaging data. Nature Methods 8(8):665–670, 2011.